Great Lakes Iron Ore Trade Up 20.7 Percent in 2023
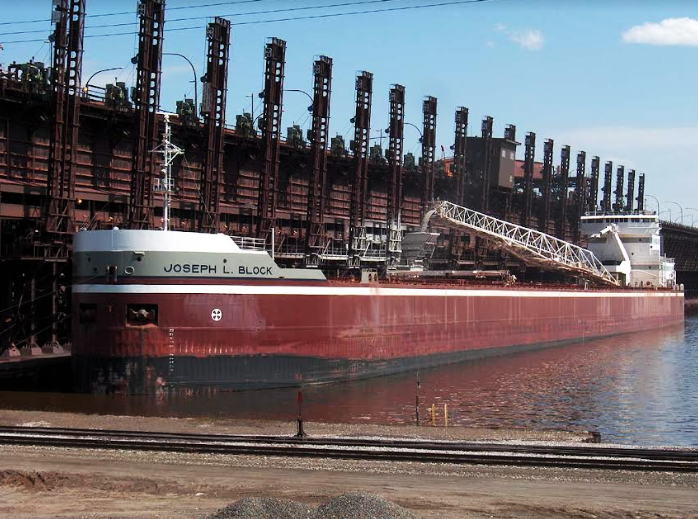
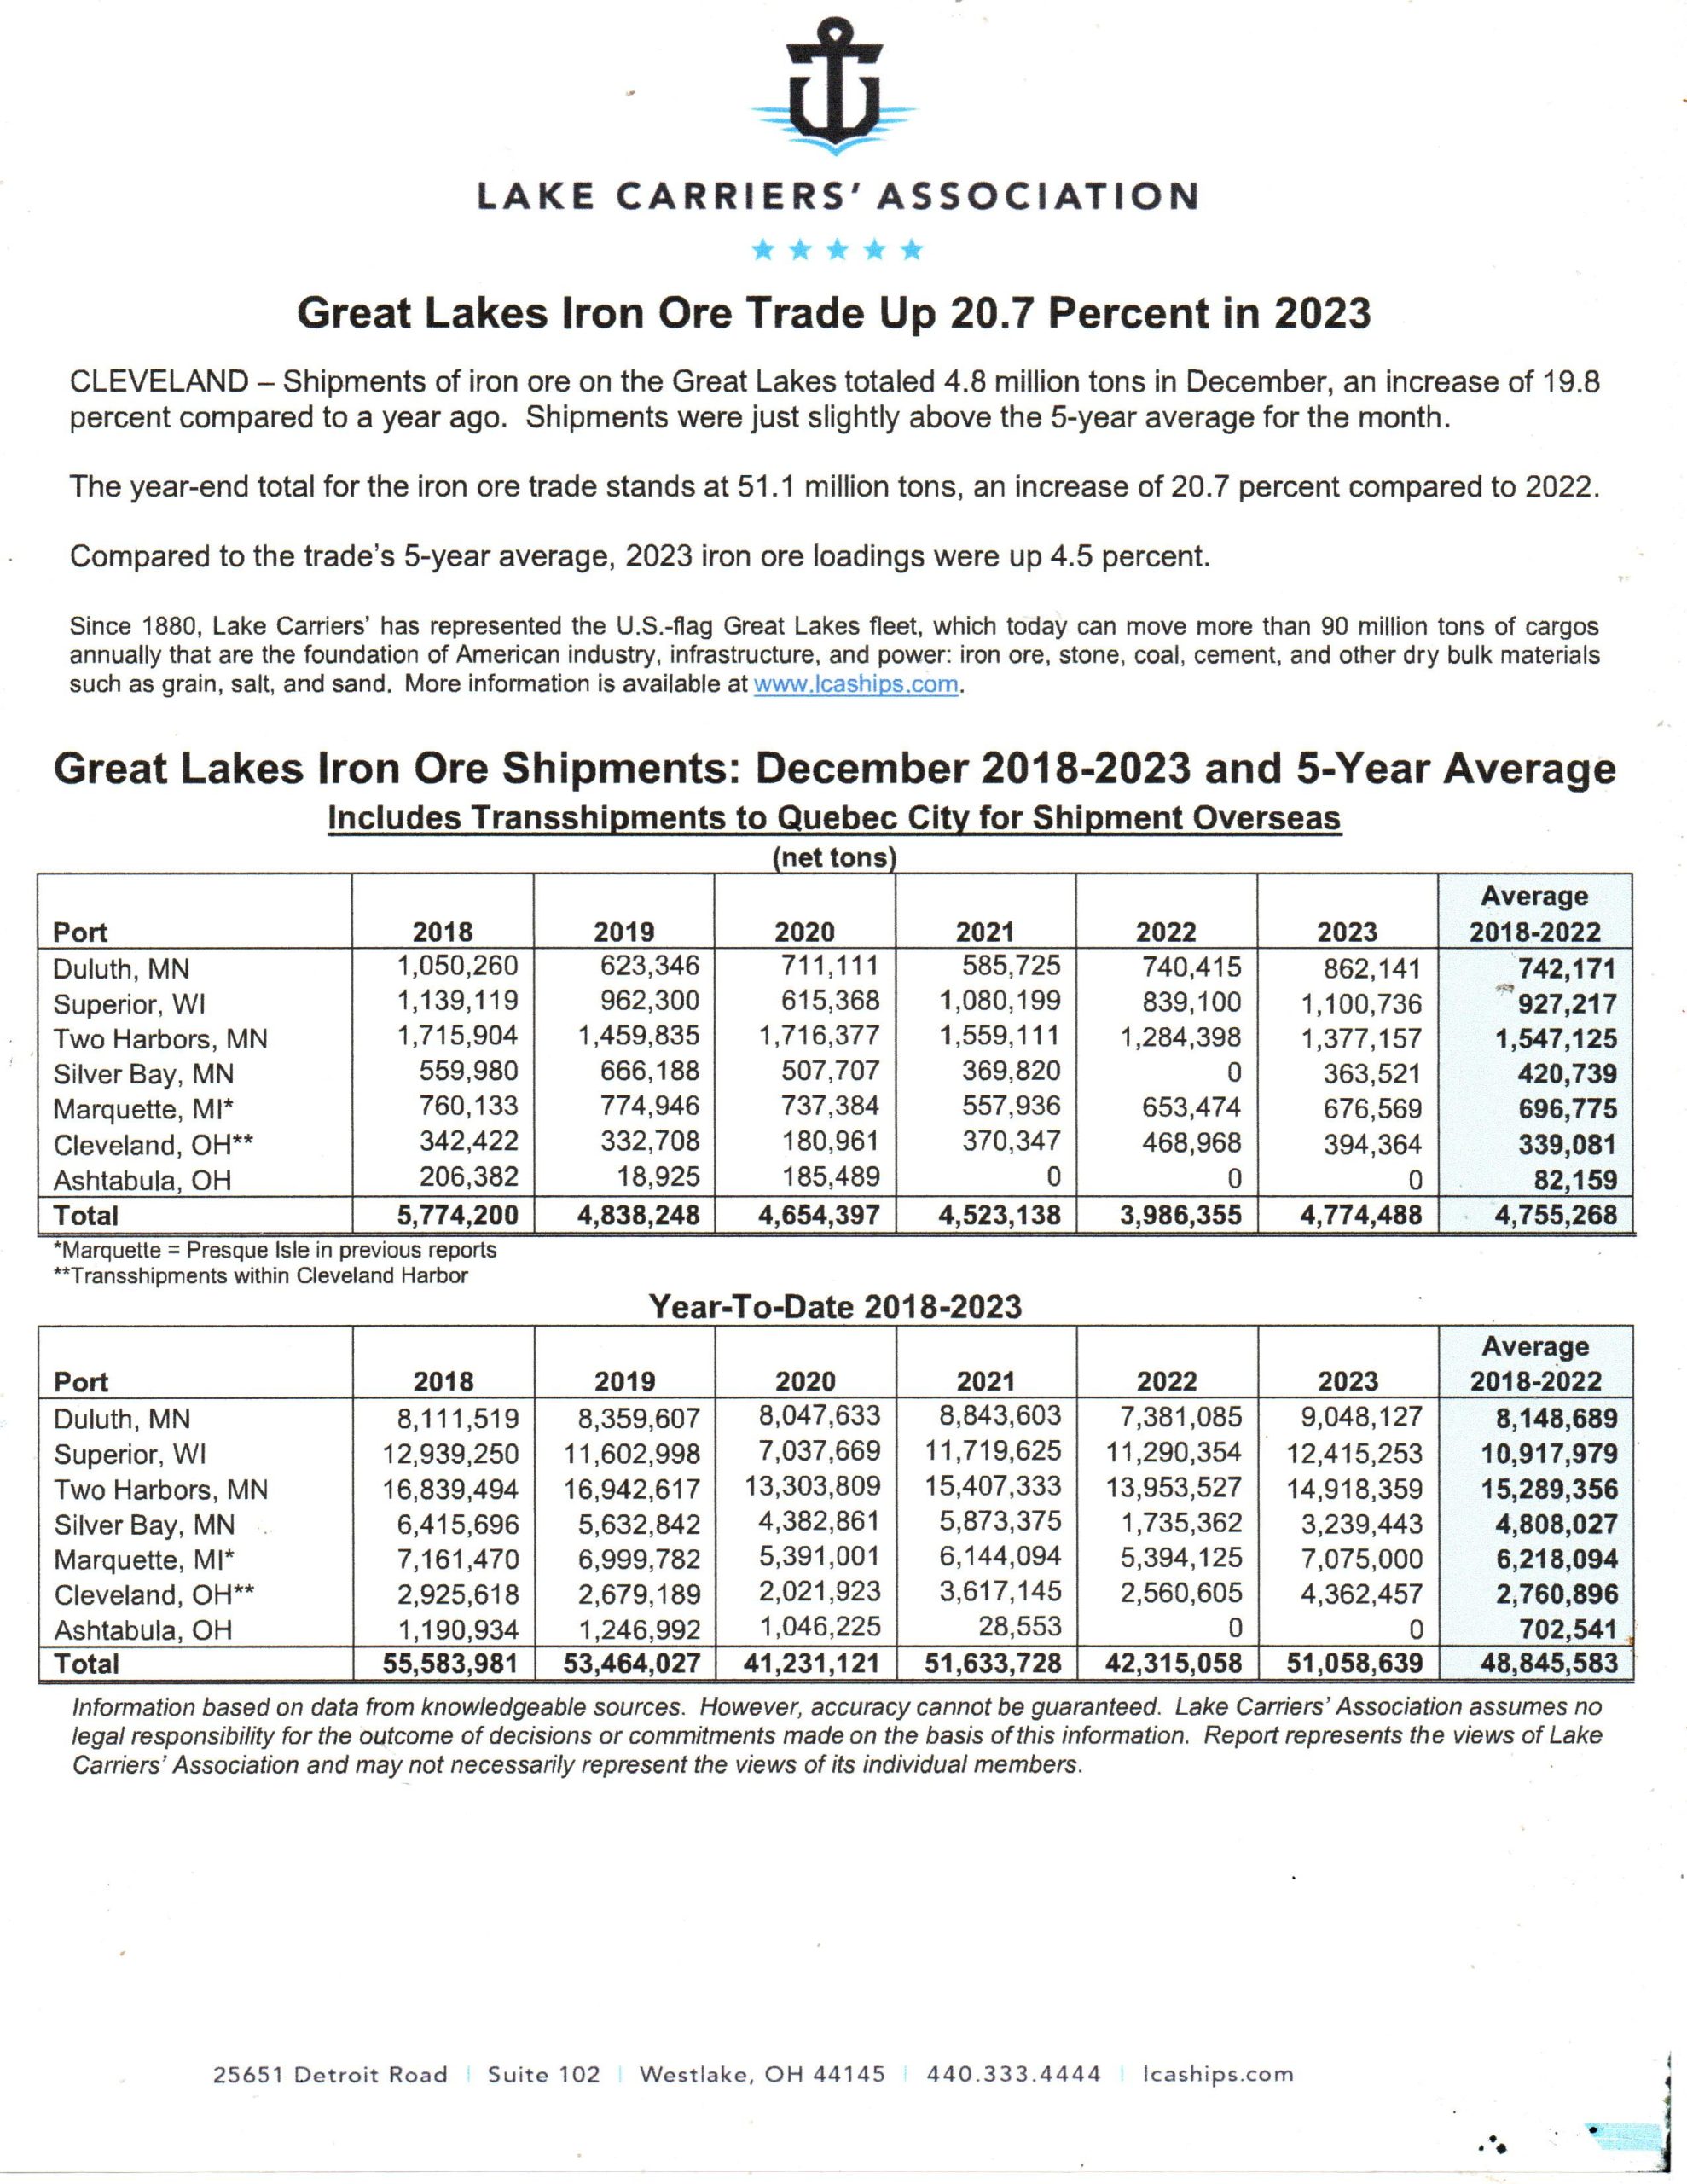
CLEVELAND – Shipments of iron ore on the Great Lakes totaled 4.8 million tons in December, an increase of 19.8 percent compared to a year ago. Shipments were just slightly above the 5-year average for the month.
The year-end total for the iron ore trade stands at 51.1 million tons, an increase of 20.7 percent compared to 2022.
Compared to the trade’s 5-year average, 2023 iron ore loadings were up 4.5 percent.
Since 1880, Lake Carriers’ has represented the U.S.-flag Great Lakes fleet, which today can move more than 90 million tons of cargos annually that are the foundation of American industry, infrastructure, and power: iron ore, stone, coal, cement, and other dry bulk materials such as grain, salt, and sand.
More information is available at www.lcaships.com.
| Great Lakes Iron Ore Shipments: December 2018-2023 and 5-Year Average | |||||||
| Includes Transshipments to Quebec City for Shipment Overseas | |||||||
| (net tons) | |||||||
| Average | |||||||
| Port | 2018 | 2019 | 2020 | 2021 | 2022 | 2023 | 2018-2022 |
| Duluth, MN | 1,050,260 | 623,346 | 711,111 | 585,725 | 740,415 | 862,141 | 742,171 |
| Superior, WI | 1,139,119 | 962,300 | 615,368 | 1,080,199 | 839,100 | 1,100,736 | 927,217 |
| Two Harbors, MN | 1,715,904 | 1,459,835 | 1,716,377 | 1,559,111 | 1,284,398 | 1,377,157 | 1,547,125 |
| Silver Bay, MN | 559,980 | 666,188 | 507,707 | 369,820 | 0 | 363,521 | 420,739 |
| Marquette, MI* | 760,133 | 774,946 | 737,384 | 557,936 | 653,474 | 676,569 | 696,775 |
| Cleveland, OH** | 342,422 | 332,708 | 180,961 | 370,347 | 468,968 | 394,364 | 339,081 |
| Ashtabula, OH | 206,382 | 18,925 | 185,489 | 0 | 0 | 0 | 82,159 |
| Total | 5,774,200 | 4,838,248 | 4,654,397 | 4,523,138 | 3,986,355 | 4,774,488 | 4,755,268 |
| *Marquette = Presque Isle in previous reports | |||||||
| **Transshipments within Cleveland Harbor | |||||||
| Year-To-Date 2018-2023 | |||||||
| Average | |||||||
| Port | 2018 | 2019 | 2020 | 2021 | 2022 | 2023 | 2018-2022 |
| Duluth, MN | 8,111,519 | 8,359,607 | 8,047,633 | 8,843,603 | 7,381,085 | 9,048,127 | 8,148,689 |
| Superior, WI | 12,939,250 | 11,602,998 | 7,037,669 | 11,719,625 | 11,290,354 | 12,415,253 | 10,917,979 |
| Two Harbors, MN | 16,839,494 | 16,942,617 | 13,303,809 | 15,407,333 | 13,953,527 | 14,918,359 | 15,289,356 |
| Silver Bay, MN | 6,415,696 | 5,632,842 | 4,382,861 | 5,873,375 | 1,735,362 | 3,239,443 | 4,808,027 |
| Marquette, MI* | 7,161,470 | 6,999,782 | 5,391,001 | 6,144,094 | 5,394,125 | 7,075,000 | 6,218,094 |
| Cleveland, OH** | 2,925,618 | 2,679,189 | 2,021,923 | 3,617,145 | 2,560,605 | 4,362,457 | 2,760,896 |
| Ashtabula, OH | 1,190,934 | 1,246,992 | 1,046,225 | 28,553 | 0 | 0 | 702,541 |
| Total | 55,583,981 | 53,464,027 | 41,231,121 | 51,633,728 | 42,315,058 | 51,058,639 | 48,845,583 |
Information based on data from knowledgeable sources. However, accuracy cannot be guaranteed. Lake Carriers’ Association assumes no legal responsibility for the outcome of decisions or commitments made on the basis of this information. Report represents the views of Lake Carriers’ Association and may not necessarily represent the views of its individual members.
Great Lakes Limestone Trade Down Slightly in 2023
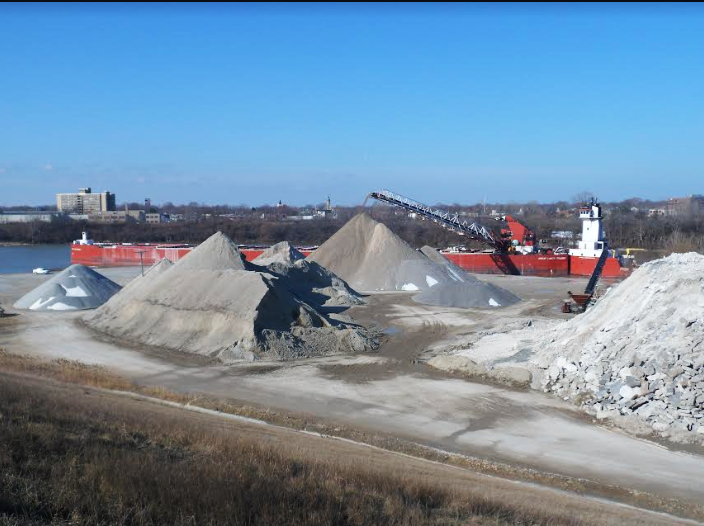
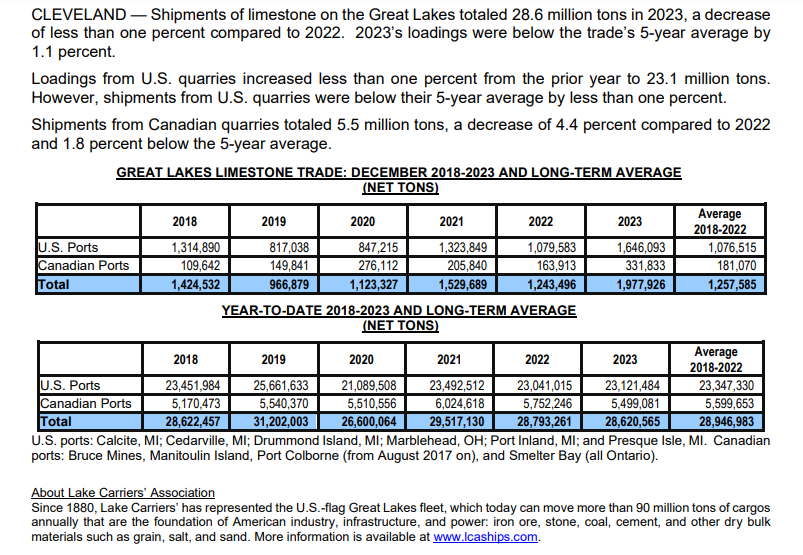
CLEVELAND — Shipments of limestone on the Great Lakes totaled 28.6 million tons in 2023, a decrease of less than one percent compared to 2022. 2023’s loadings were below the trade’s 5-year average by 1.1 percent.
Loadings from U.S. quarries increased less than one percent from the prior year to 23.1 million tons. However, shipments from U.S. quarries were below their 5-year average by less than one percent.
Shipments from Canadian quarries totaled 5.5 million tons, a decrease of 4.4 percent compared to 2022 and 1.8 percent below the 5-year average.
GREAT LAKES LIMESTONE TRADE: DECEMBER 2018-2023 AND LONG-TERM AVERAGE
(NET TONS)
| 2018 | 2019 | 2020 | 2021 | 2022 | 2023 | Average 2018-2022 |
|
| U.S. Ports | 1,314,890 | 817,038 | 847,215 | 1,323,849 | 1,079,583 | 1,646,093 | 1,076,515 |
| Canadian Ports | 109,642 | 149,841 | 276,112 | 205,840 | 163,913 | 331,833 | 181,070 |
| Total | 1,424,532 | 966,879 | 1,123,327 | 1,529,689 | 1,243,496 | 1,977,926 | 1,257,585 |
YEAR-TO-DATE 2018-2023 AND LONG-TERM AVERAGE
(NET TONS)
| 2018 | 2019 | 2020 | 2021 | 2022 | 2023 | Average 2018-2022 |
|
| U.S. Ports | 23,451,984 | 25,661,633 | 21,089,508 | 23,492,512 | 23,041,015 | 23,121,484 | 23,347,330 |
| Canadian Ports | 5,170,473 | 5,540,370 | 5,510,556 | 6,024,618 | 5,752,246 | 5,499,081 | 5,599,653 |
| Total | 28,622,457 | 31,202,003 | 26,600,064 | 29,517,130 | 28,793,261 | 28,620,565 | 28,946,983 |
U.S. ports: Calcite, MI; Cedarville, MI; Drummond Island, MI; Marblehead, OH; Port Inland, MI; and Presque Isle, MI. Canadian ports: Bruce Mines, Manitoulin Island, Port Colborne (from August 2017 on), and Smelter Bay (all Ontario).
About Lake Carriers’ Association
Since 1880, Lake Carriers’ has represented the U.S.-flag Great Lakes fleet, which today can move more than 90 million tons of cargos annually that are the foundation of American industry, infrastructure, and power: iron ore, stone, coal, cement, and other dry bulk materials such as grain, salt, and sand. More information is available at www.lcaships.com.
‘Tis the Season for the Winter Lay-up List
You can monitor our annual lay-up listing page here: https://boatnerd3.jasonbowlerdesign.com/winter-lay-up-list-2023-2024/
The page will be updated throughout the winter. Please send lay-up reports to news@boatnerd.net.